Using a debugger
As you continue learning to program, you will write larger programs, composed of many functions. When something goes wrong and your program does not work as you expected, you should use a debugger to help you find and fix the error. PyCharm has a built-in debugger that we will show you how to use.
The two most important things you will learn from CS 110 that will help you throughout your career:
(1) Decomposing programs
(2) Using a debugger
A demo program
To learn how to use a debugger, we are going to work with the following program.
Put this program into a file called debugger_demo.py in your unit3 folder:
def get_name() -> str:
name = input('Hello, what is your name? ')
return name
def get_age() -> str:
age = input('And what is your age? ')
return age
def print_message(name: str, age: str):
print(f'{age} years ago, {name} was born!')
def main():
name = get_name()
age = get_age()
print_message(name, age)
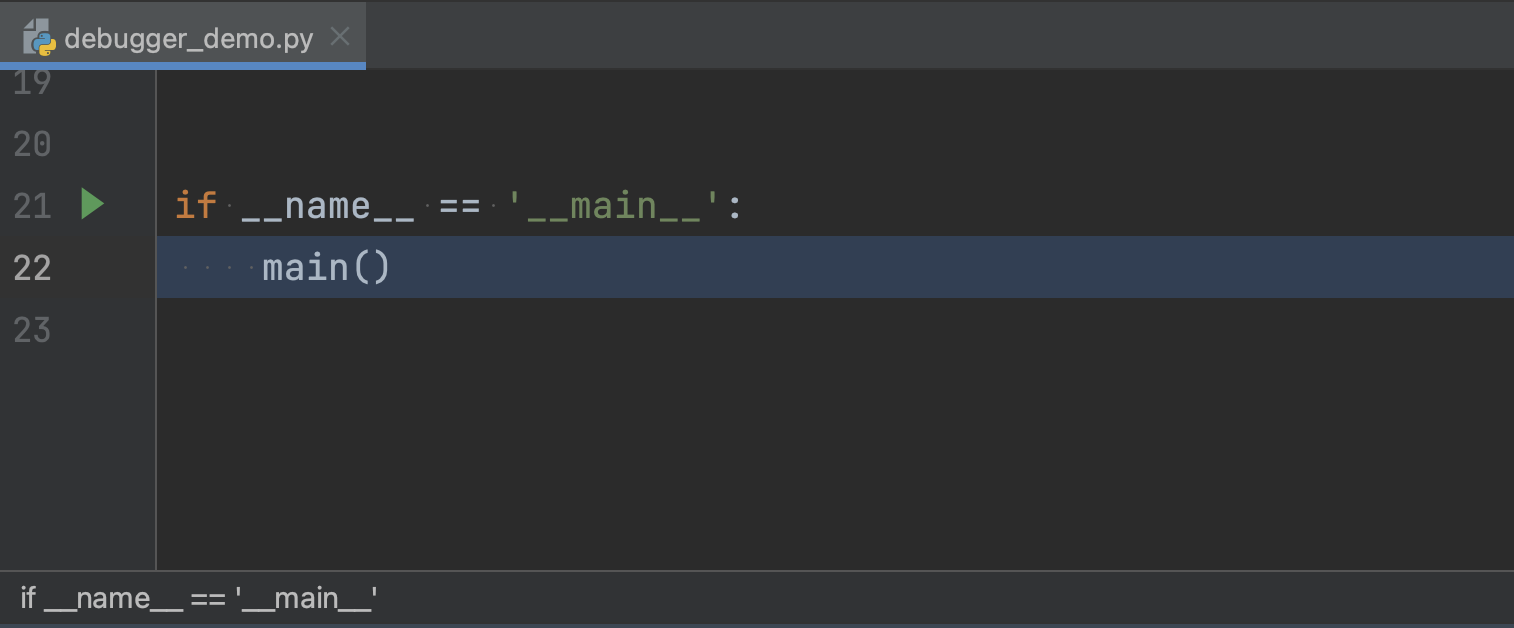
if __name__ == '__main__':
main()Run this program and you should see something like this:
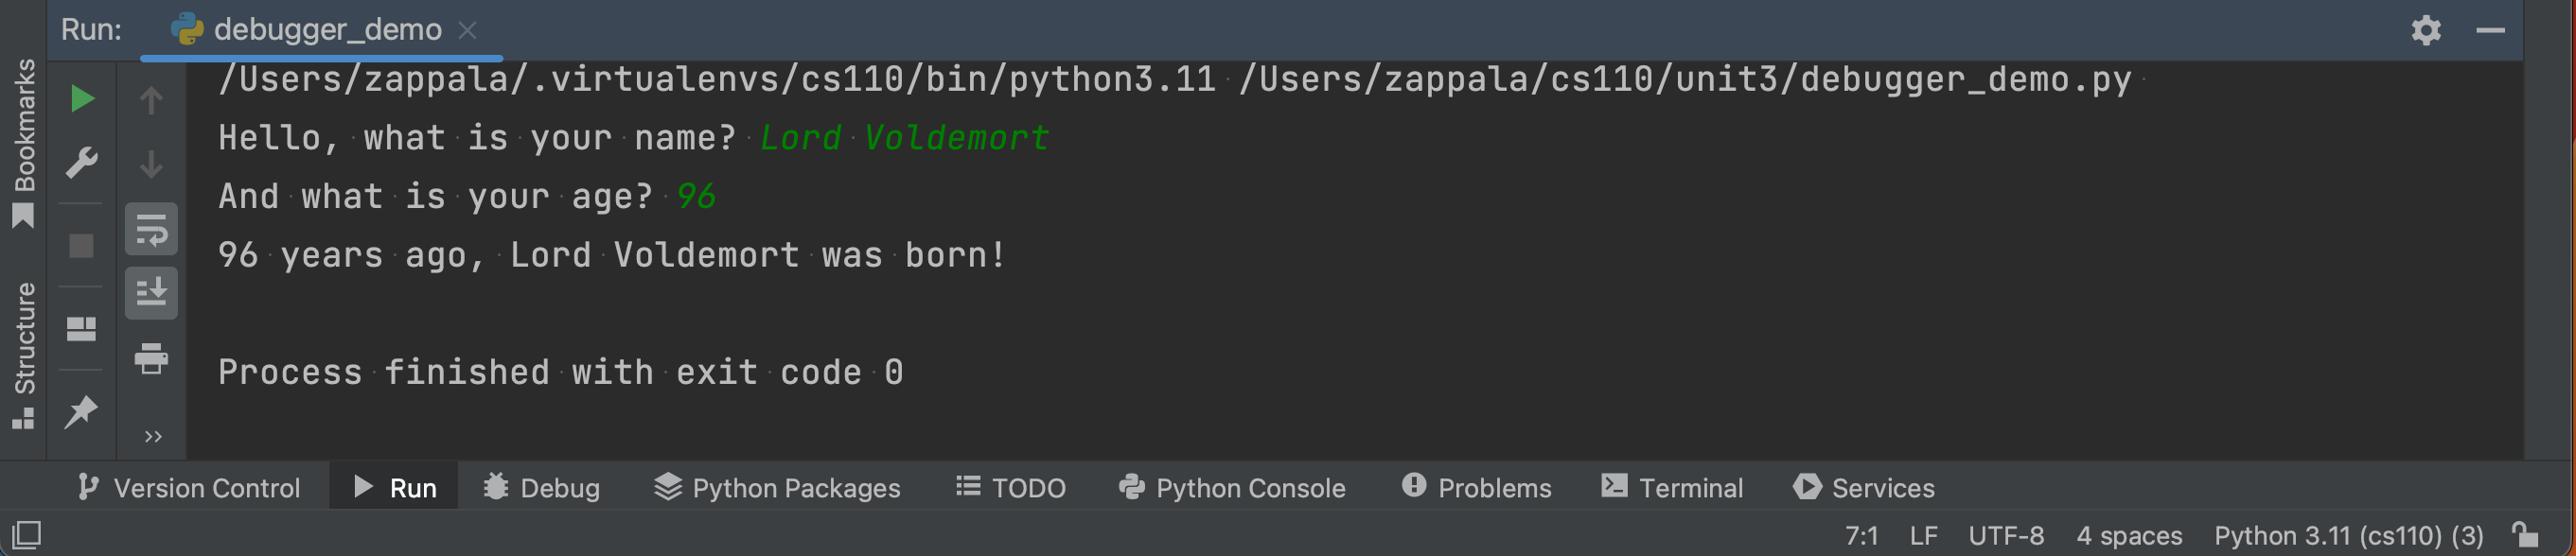
How does this program work? Python goes through the following steps:
- runs the main block inside
if __name__ == '__main__' - runs the
main()function - runs the
get_name()function, which returns a name that is stored inname - runs the
get_age()function, which returns an age that is stored inage - runs the
print_message()function, which usesnameandageto print the message you see
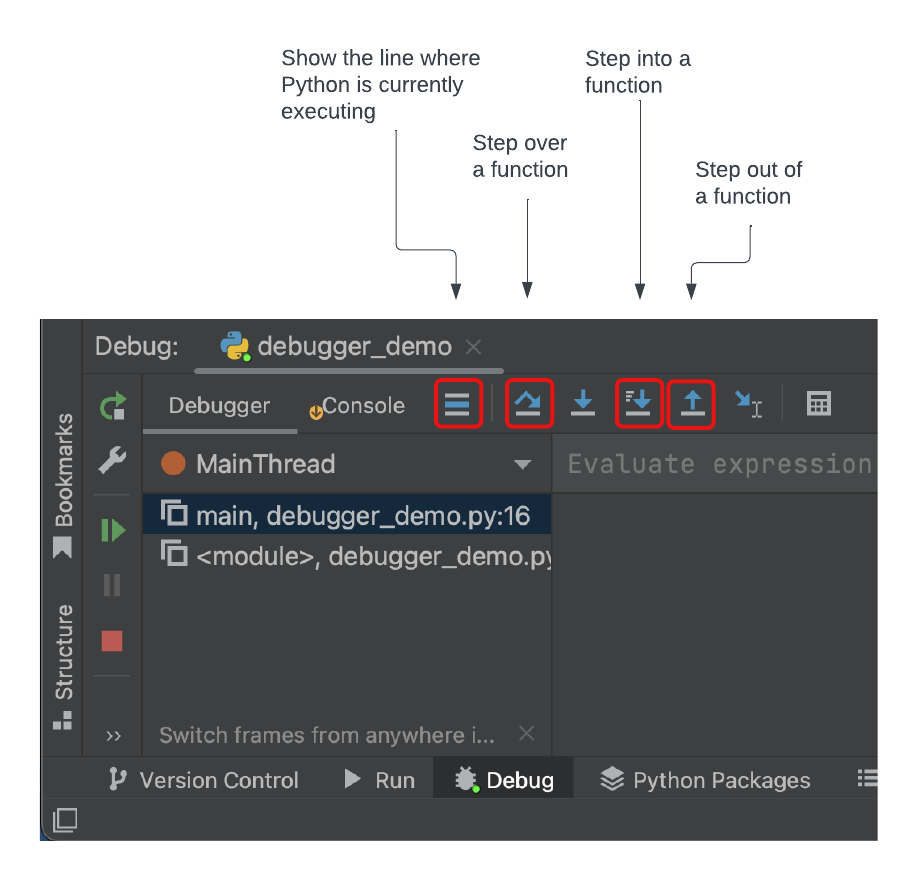
The PyCharm debugger
To use the PyCharm debugger, you will want to create a breakpoint, which is a
place to stop and examine your program. You can choose any line of code in your
program and tell the debugger stop here, I want to see what is going on.
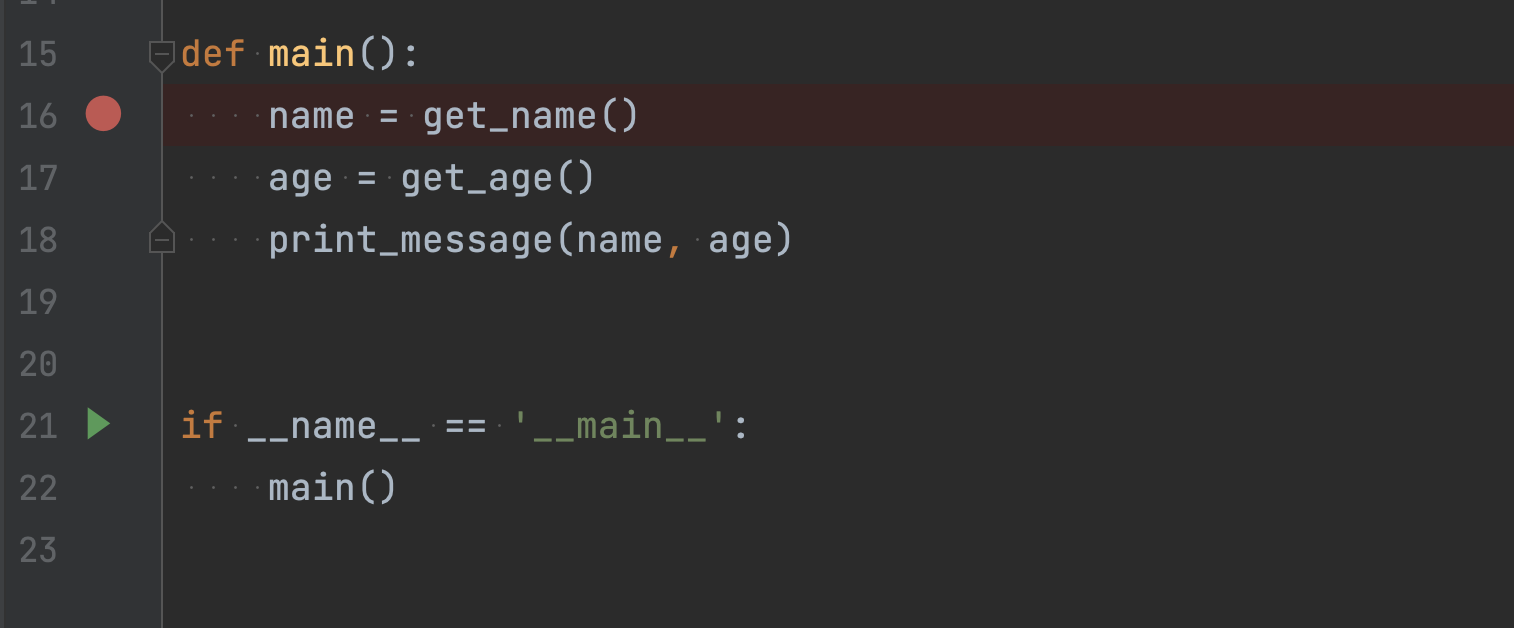
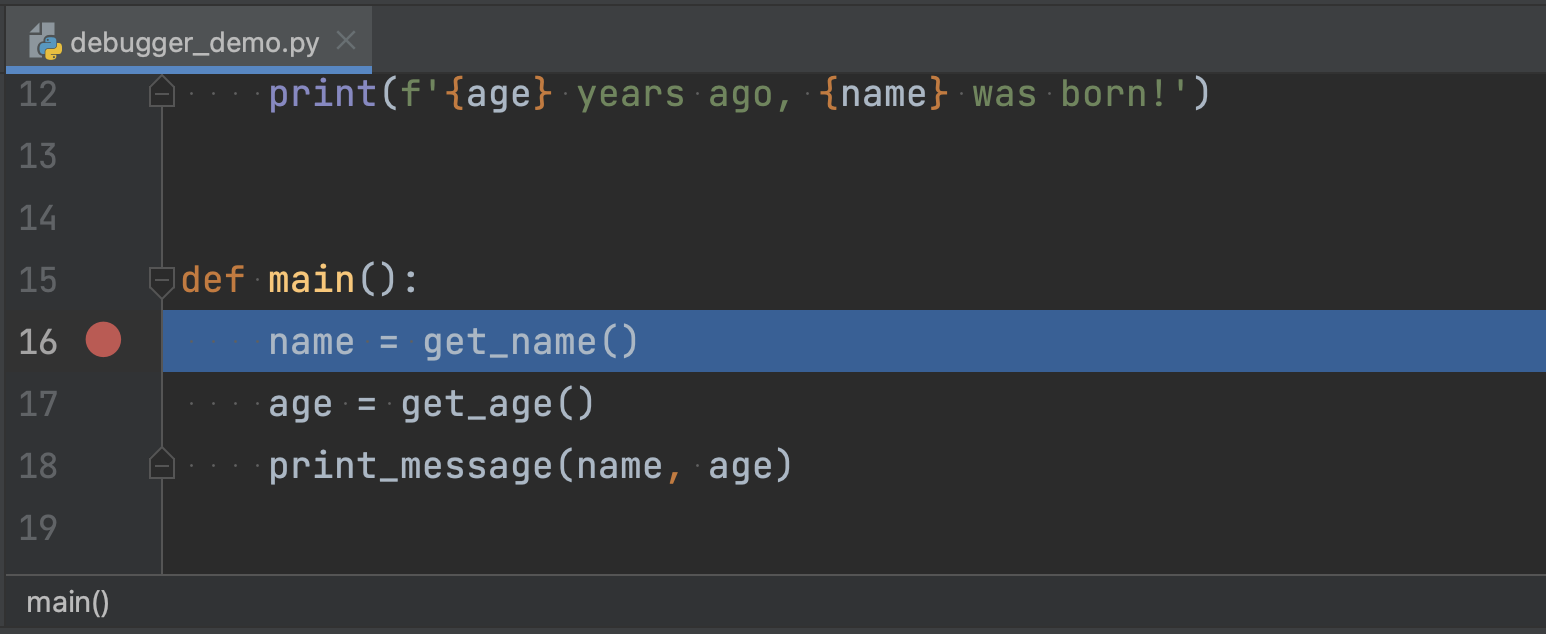
You create a breakpoint in PyCharm by clicking just to the right of a line number.
In your code, click next to line 16 to create a breakpoint. PyCharm shows the breakpoint as a red dot:
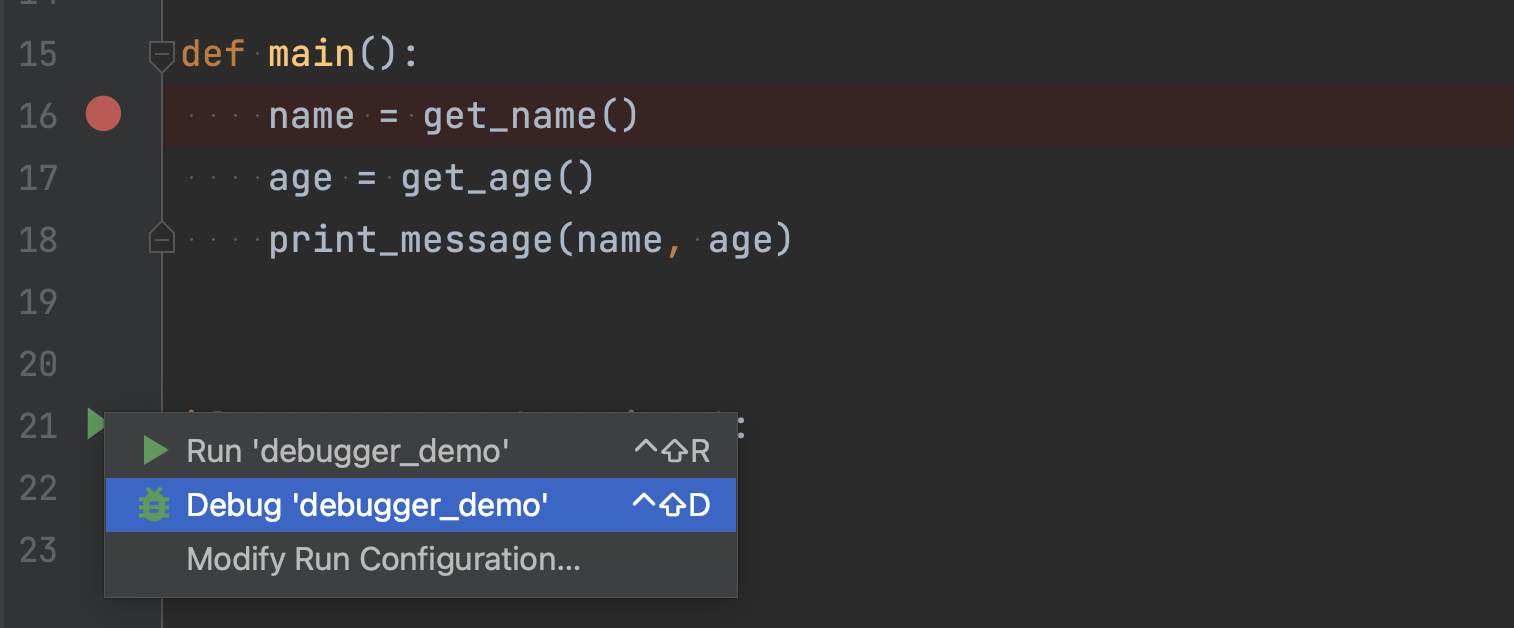
Now click the green triangle in the main block, like you would if you were going
to run the program, but instead select Debug:
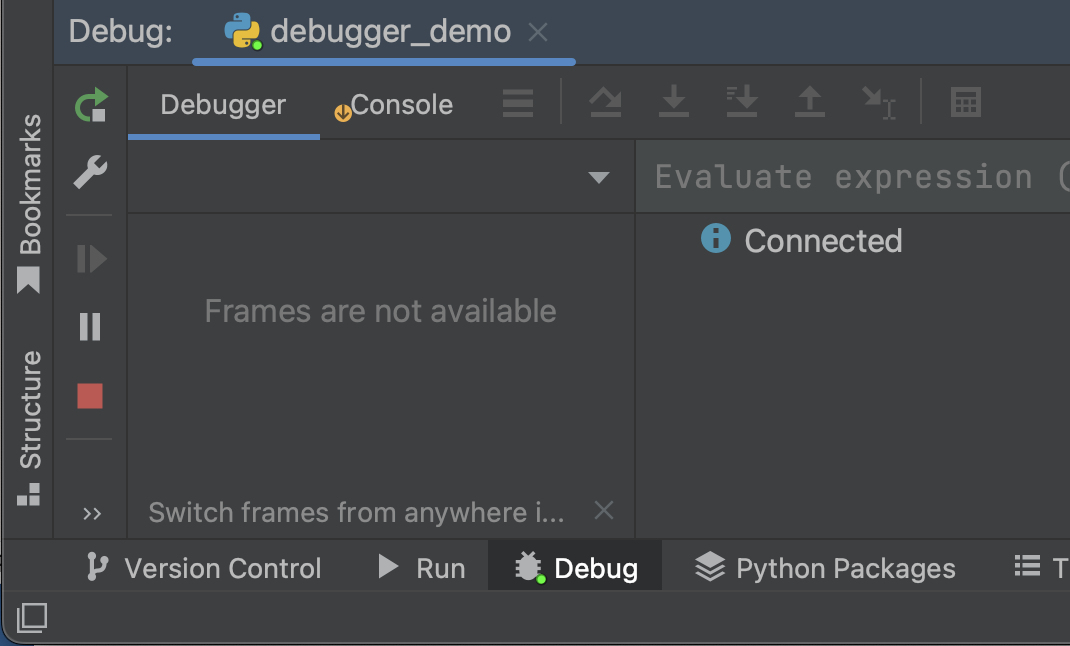
This will open the debugging window at the bottom of the screen:
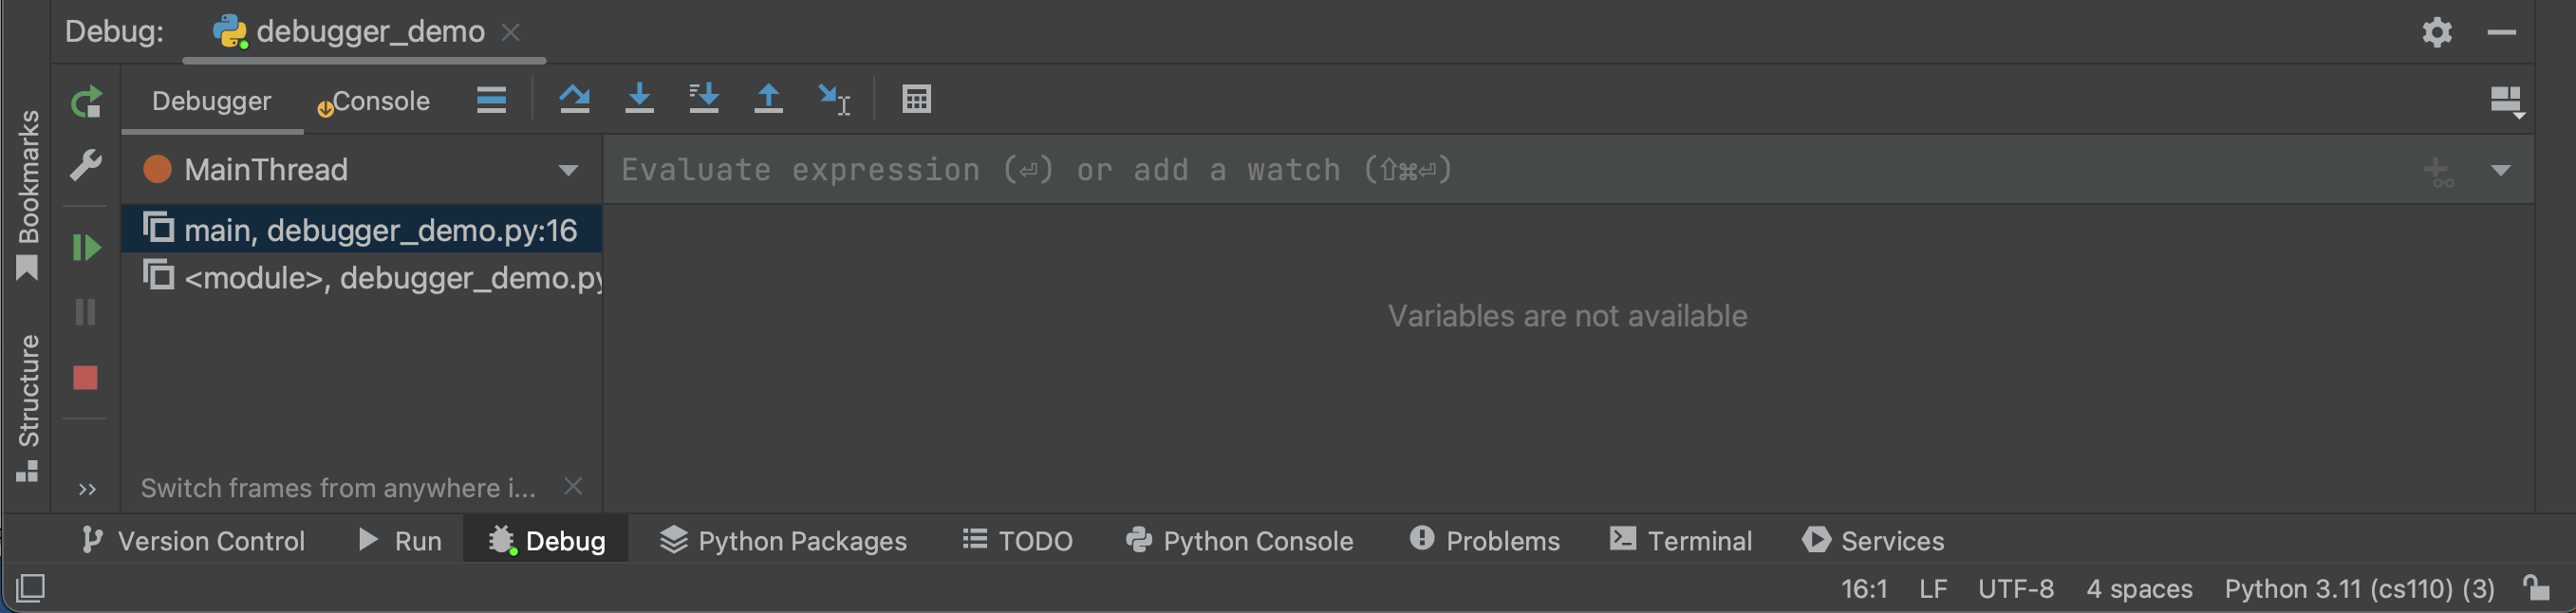
Meanwhile, the main window shows that Python has run your program, but then stopped when it got to line 16:
The function stack
The debugger window shows you a stack of the functions your program is currently using. They are ordered from most recent on the top to oldest on the bottom:
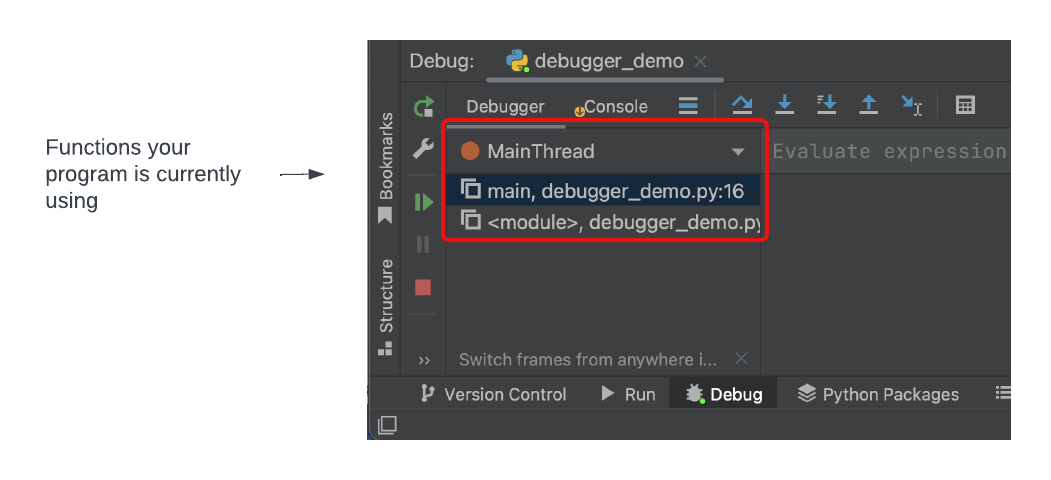
The top function listed, main is the function your program is currently in,
which is where we set the breakpoint.
Click on the bottom function listed, module:
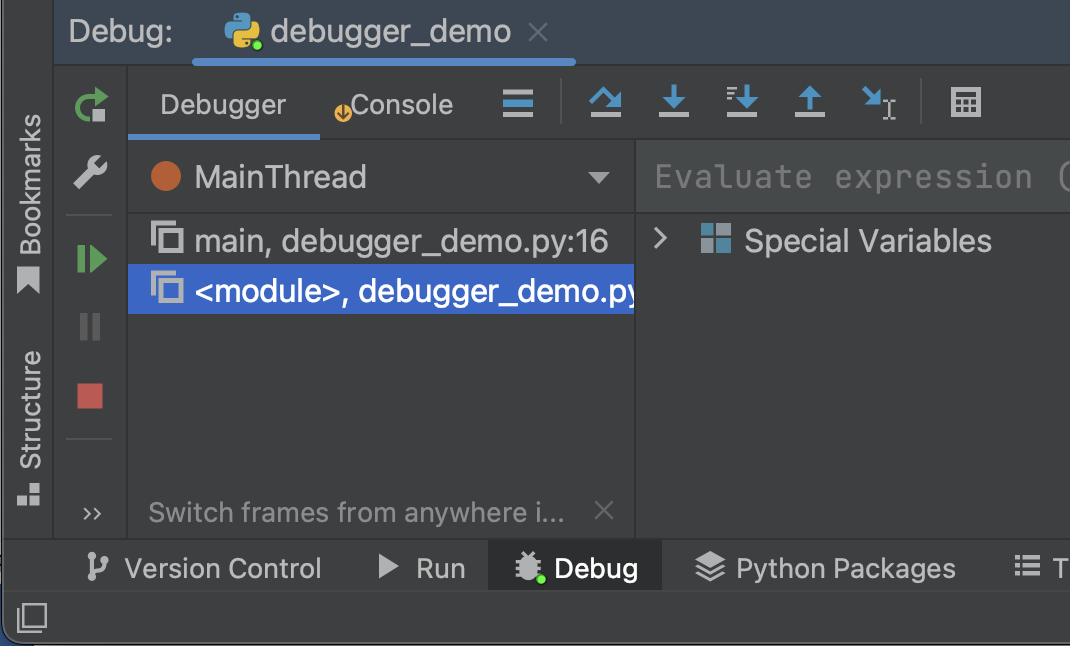
and the top window will change to show you that this is where Python started running your code, on line 22:
Python ran your main block, executed line 22, and in doing that, saw that it
needed to run main().
Now click main in the function stack, and you will back to main() on
line 16.
Stepping over
In the debugging window, you will see some useful buttons on the top:
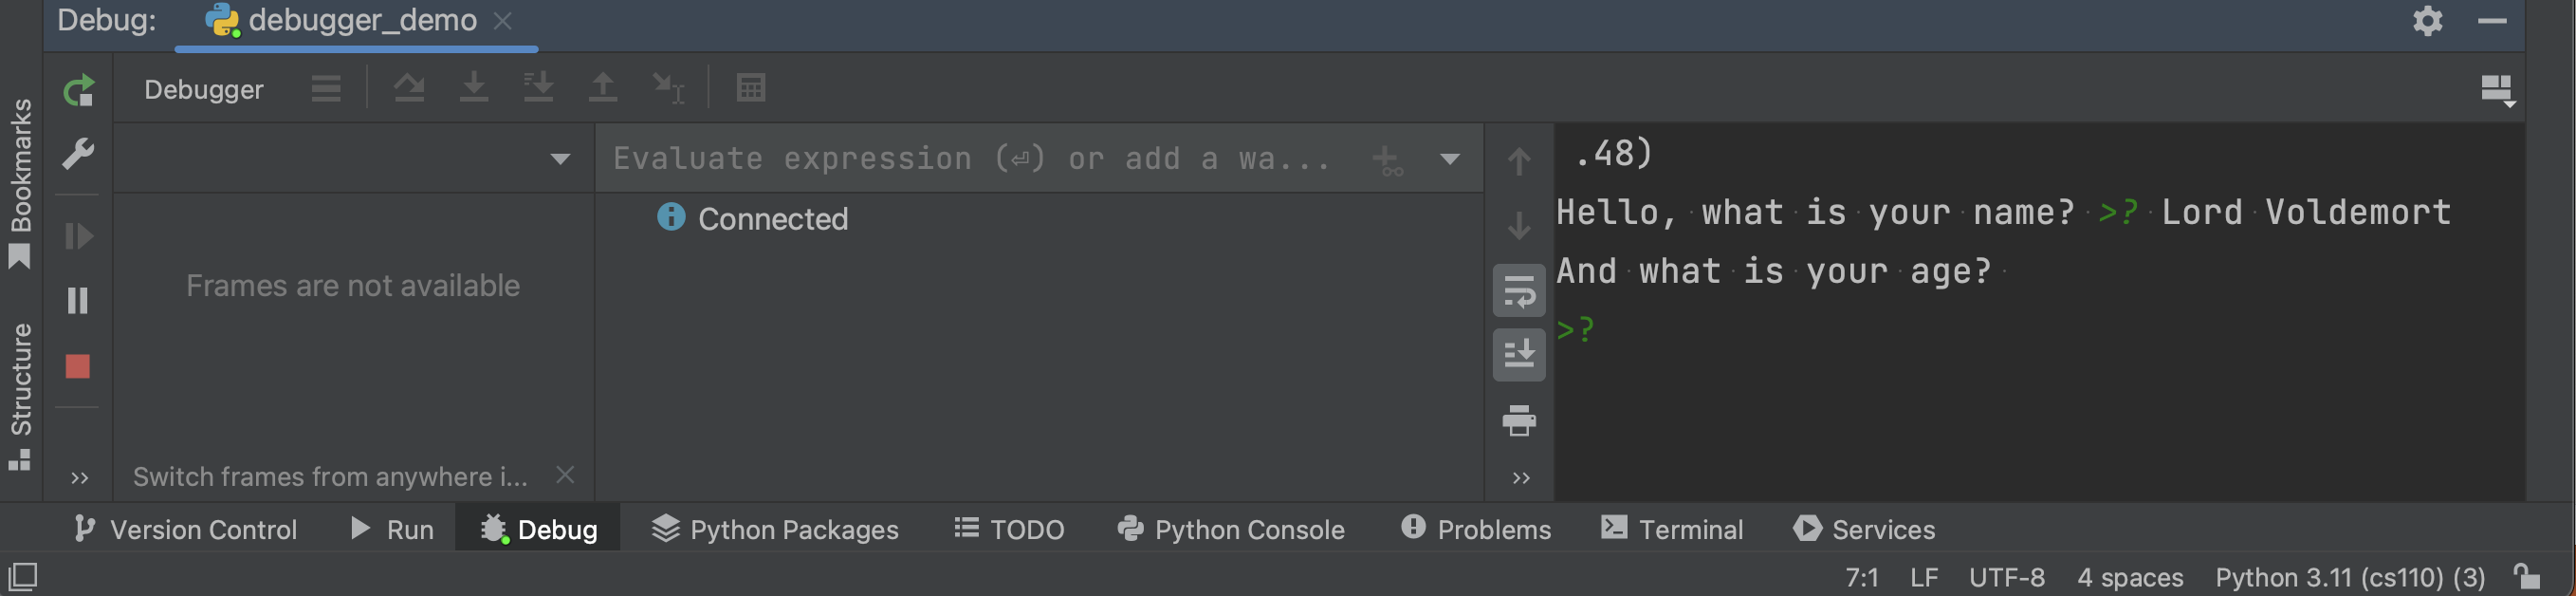
Click the step over button. This will execute line 16. You will see the function stack go blank, with a small yellow circle and arrow symbol by the Console tab:
Click on the Console tab, and you will see that that Python is in the middle
of running line 16, which calls the get_name() function. That function uses
input(), and the console is waiting for you to type something.
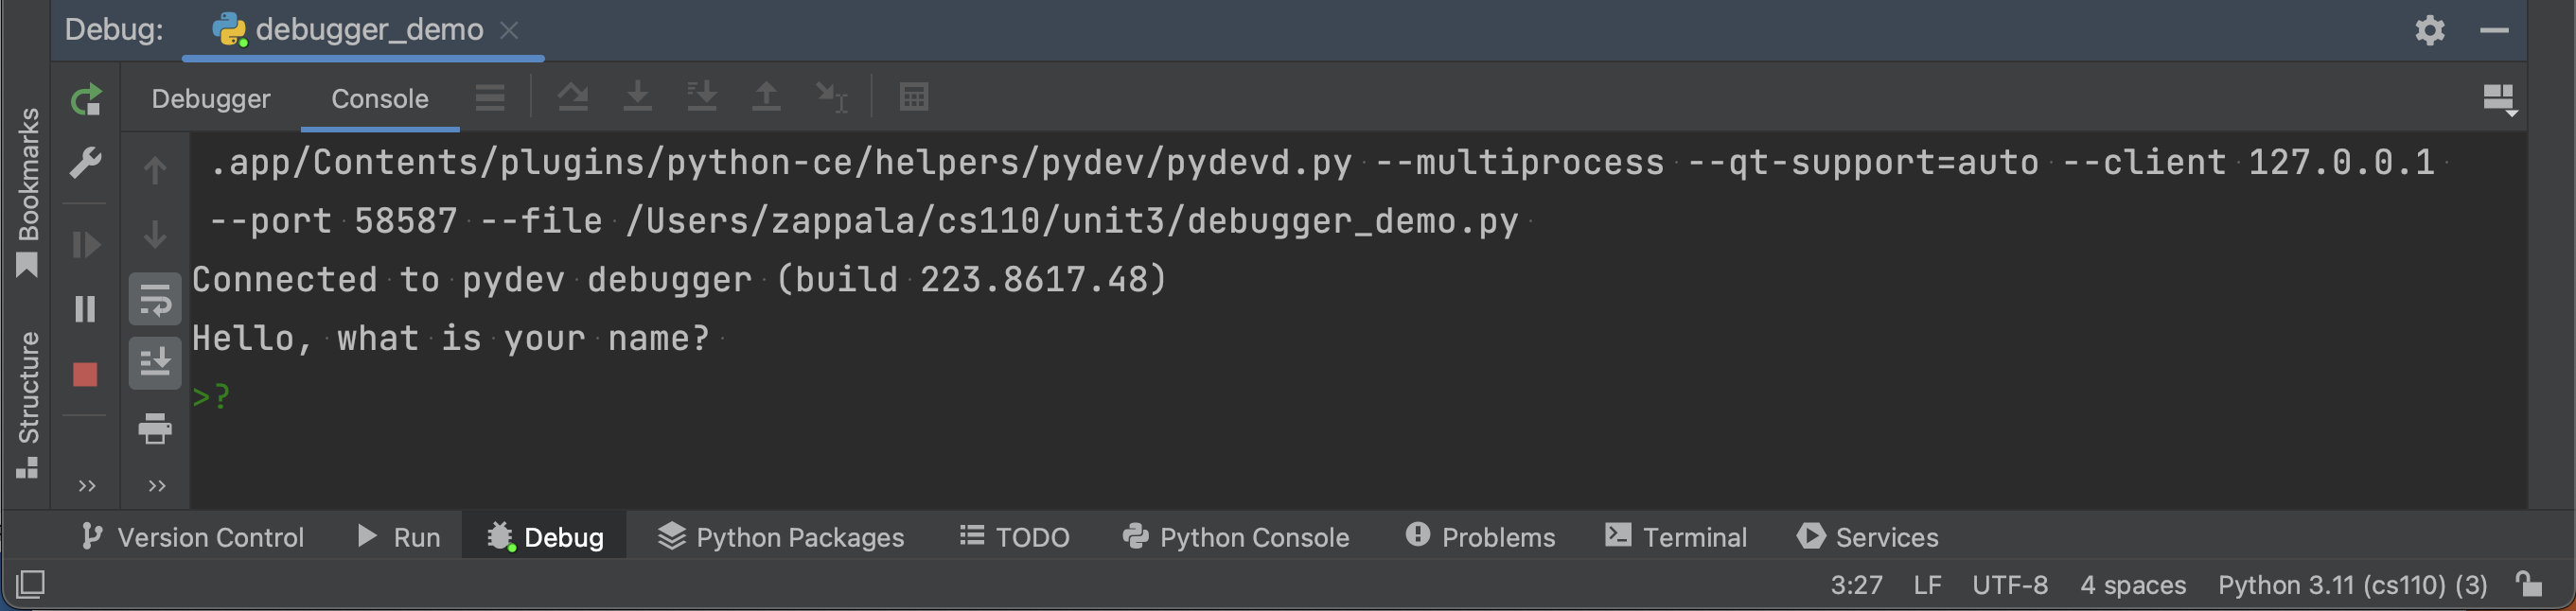
Type in a name and press enter. If you click back to the Debugger window, you
will see whatever you typed is now stored in the name variable:
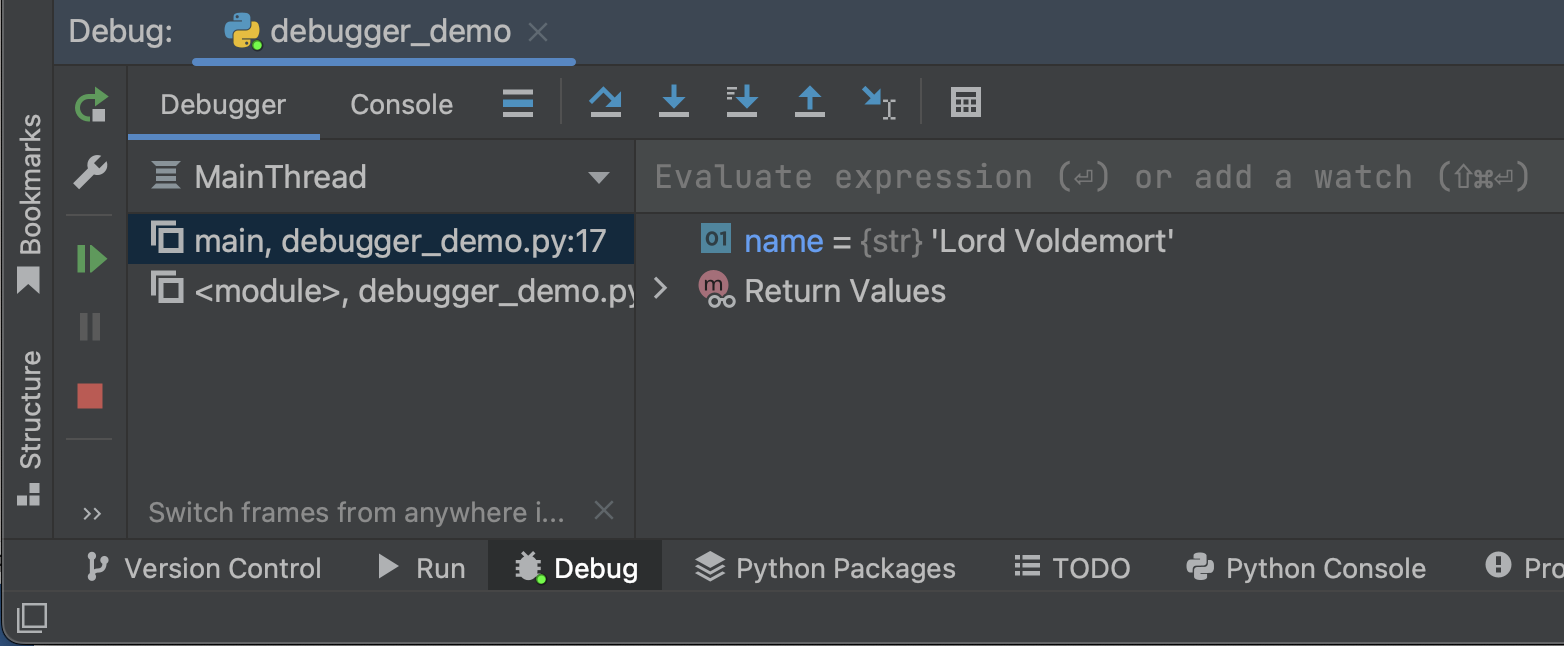
You will also see the main window has advanced and the debugger is now on line 17:
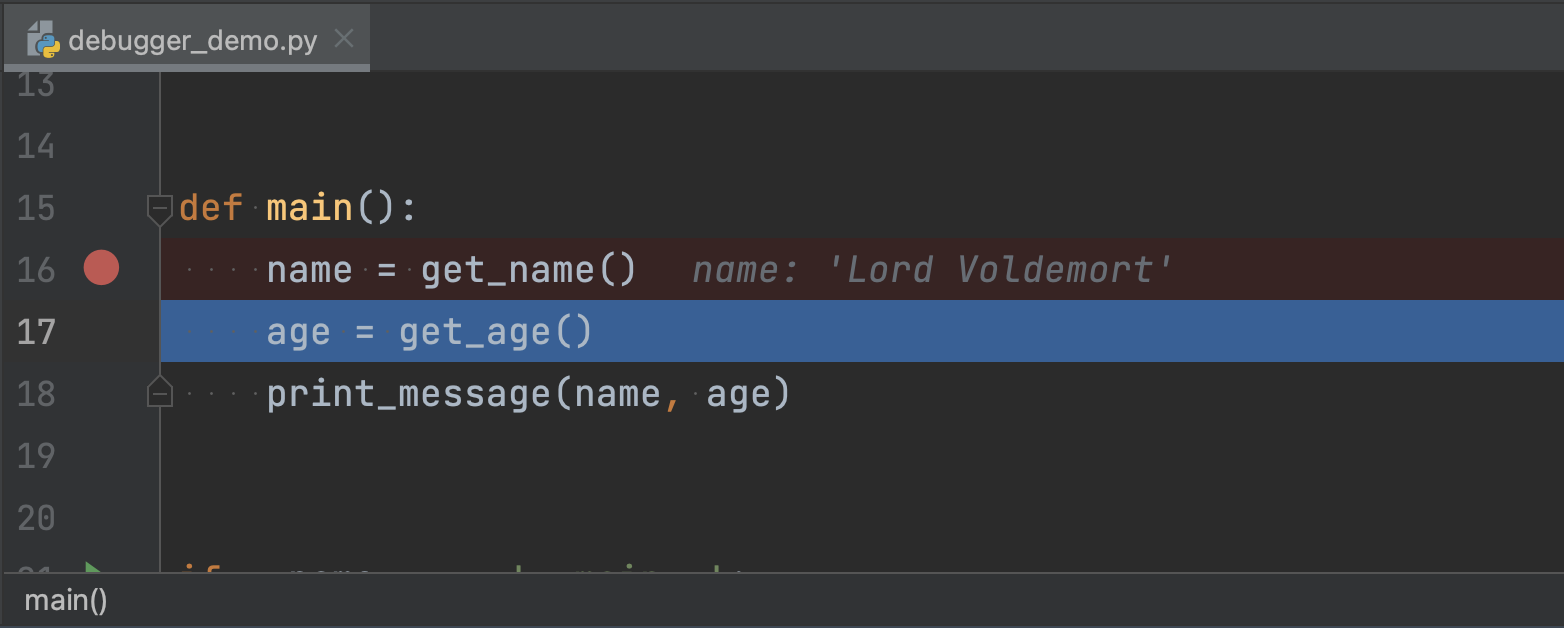
You will also see that the value of the name variable is shown to the right of
line 16.
You can see literally everything that Python is doing when it runs your code! :-)
Stepping into
Now click the step into button in the debugger window.
This will run line 17 of your code. Line 17 tells Python to run the get_age()
function. Since you clicked step into, PyCharm will take you to the first line
of get_age(), which is line 7 of the code:
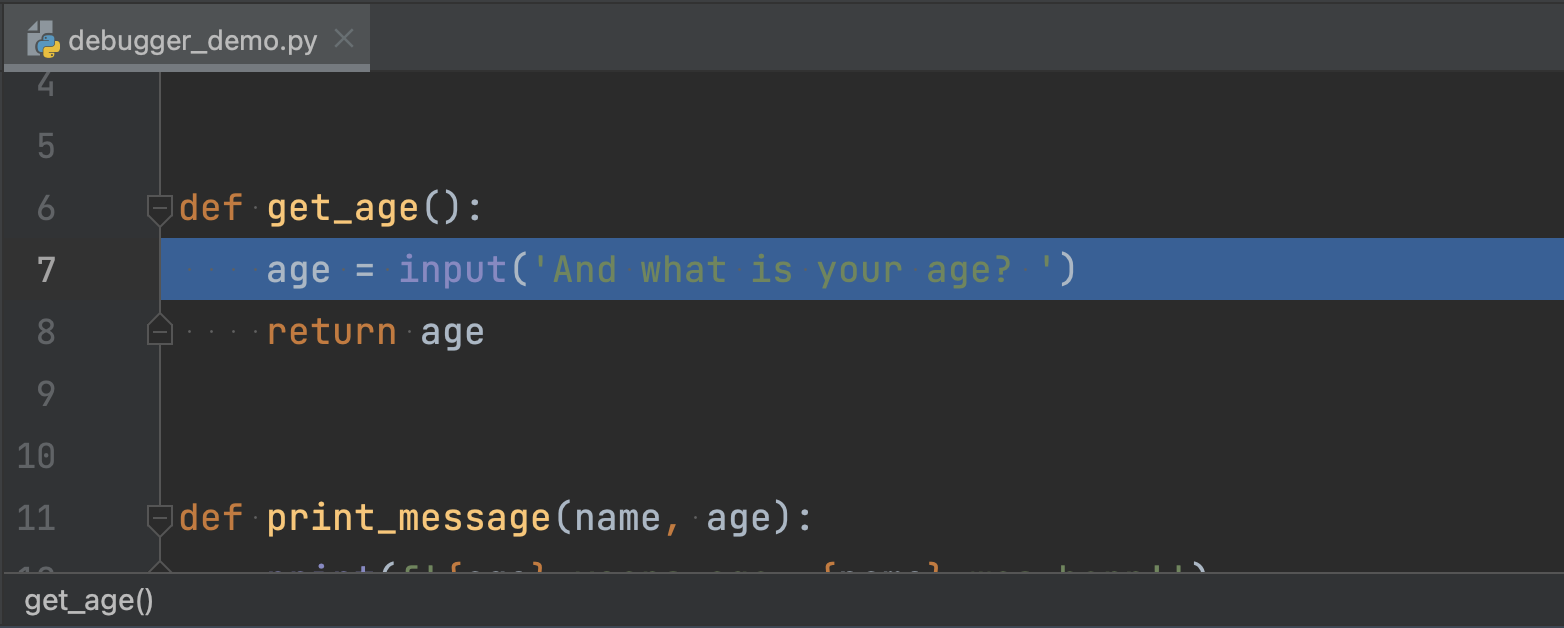
Python has not yet executed line 7. It is sitting there telling you that this is the next line of code it will execute.
Notice that the function stack in the debugger window shows that you are now in
the get_age() function:
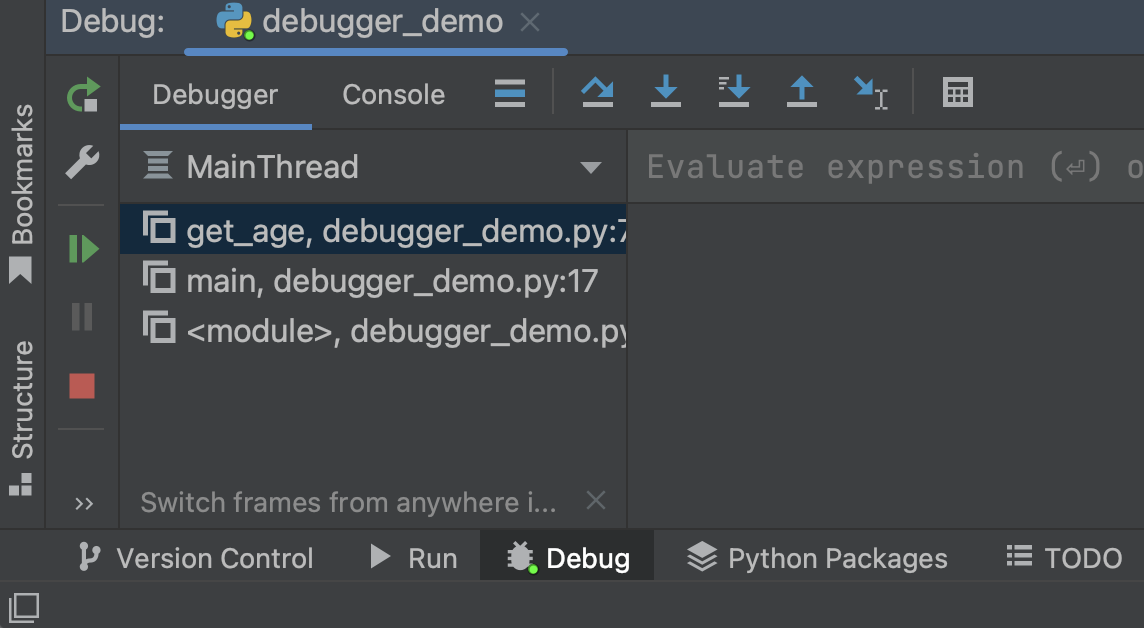
PyCharm has added a function to the top of the stack, to keep track of where you have been while you run the program, and where you are now. You can click on any one of these functions to see the path your program took to this point.
Console and debugger side-by-side
You don’t have to constantly click back and forth between the debugger window and the console window. Click on the console tab and drag it over to the far right of the debugger window:
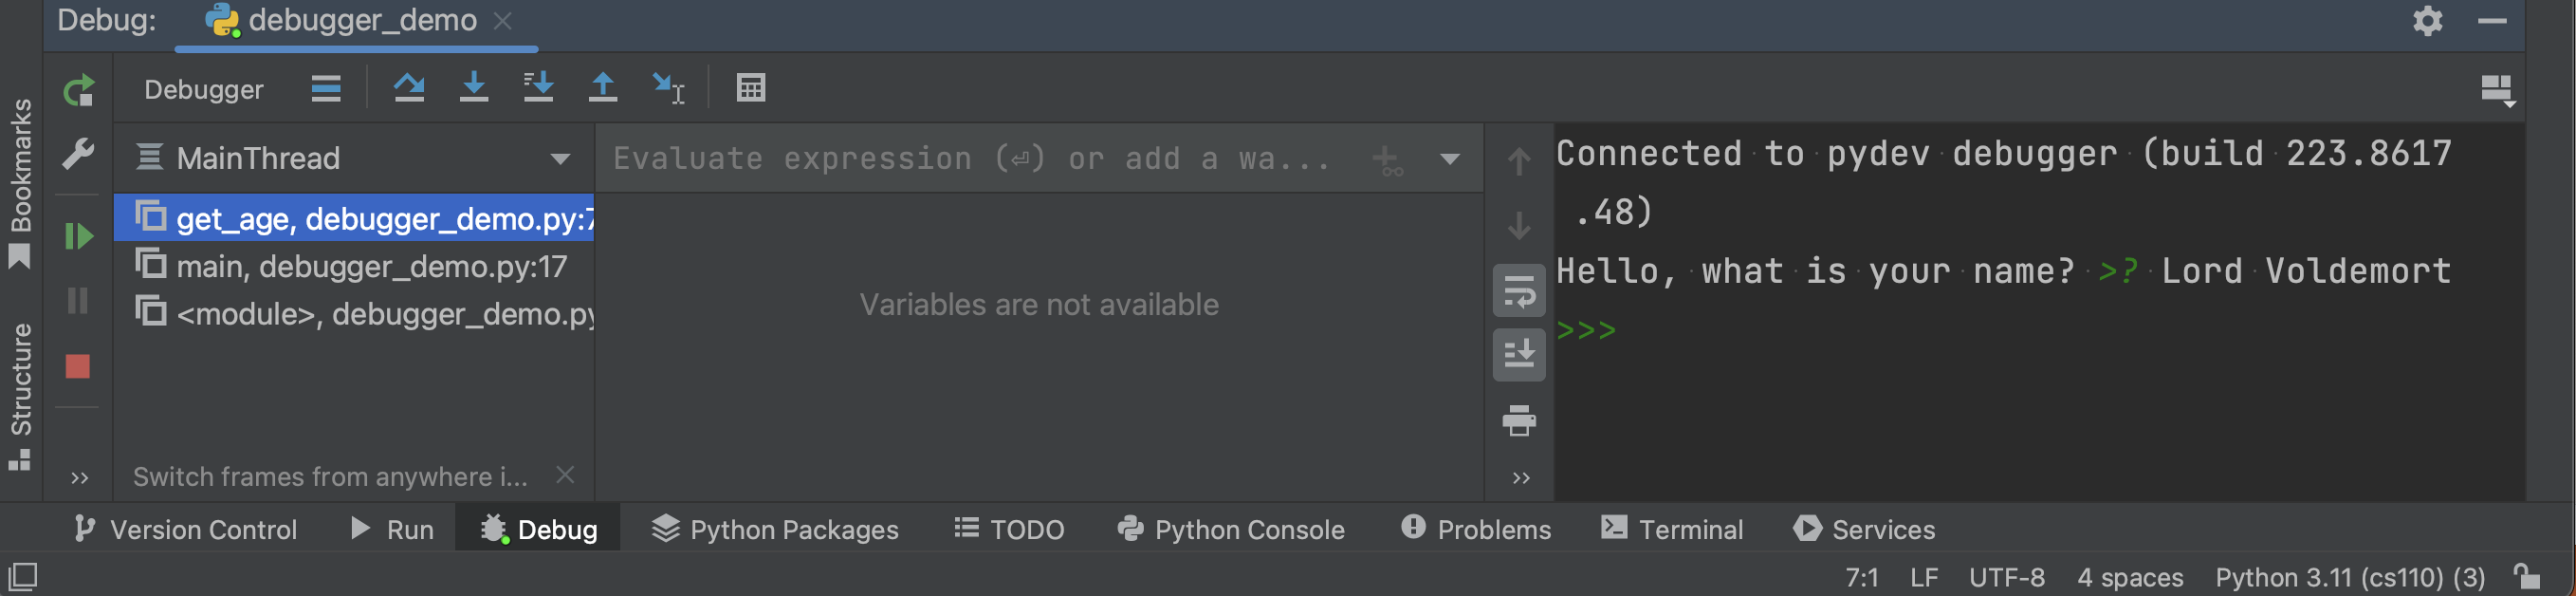
This will make it easier to see everything that is going on.
Some more debugging
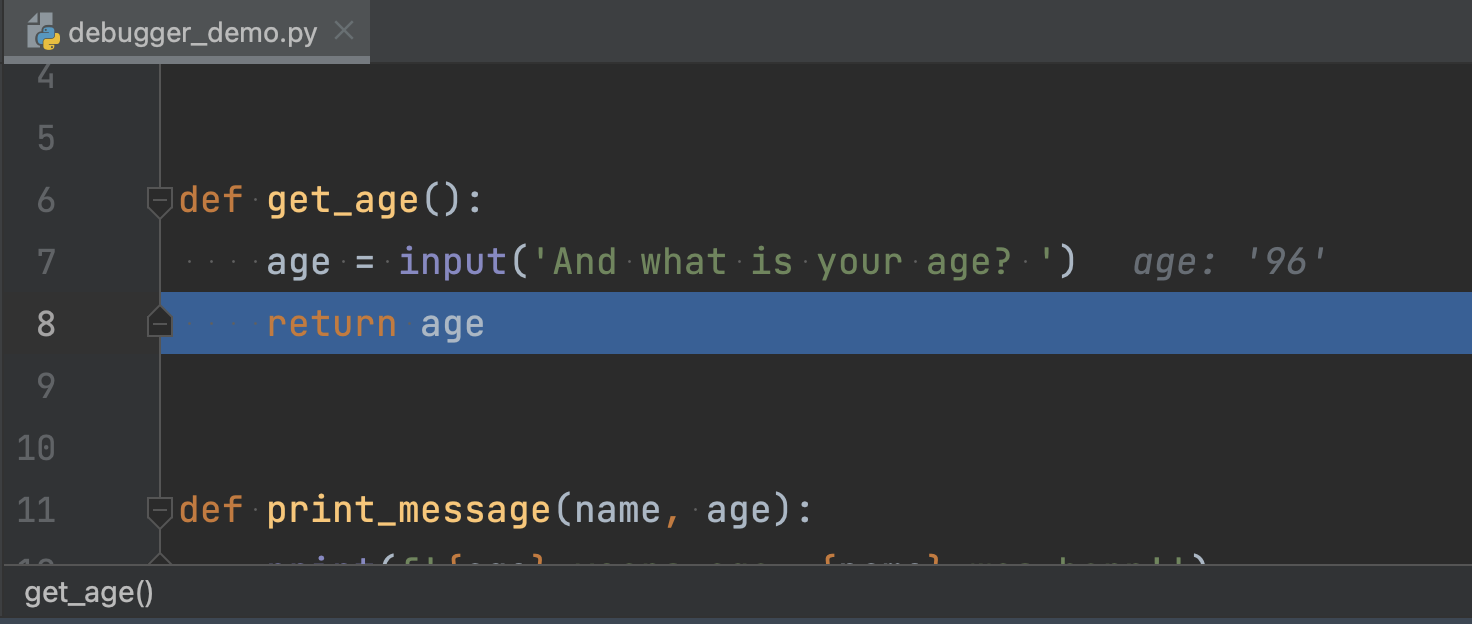
Now click the step over button another time. This runs line 7, which asks for
input:
Type in your age and press enter. You will see that the age variable contains
what you typed:
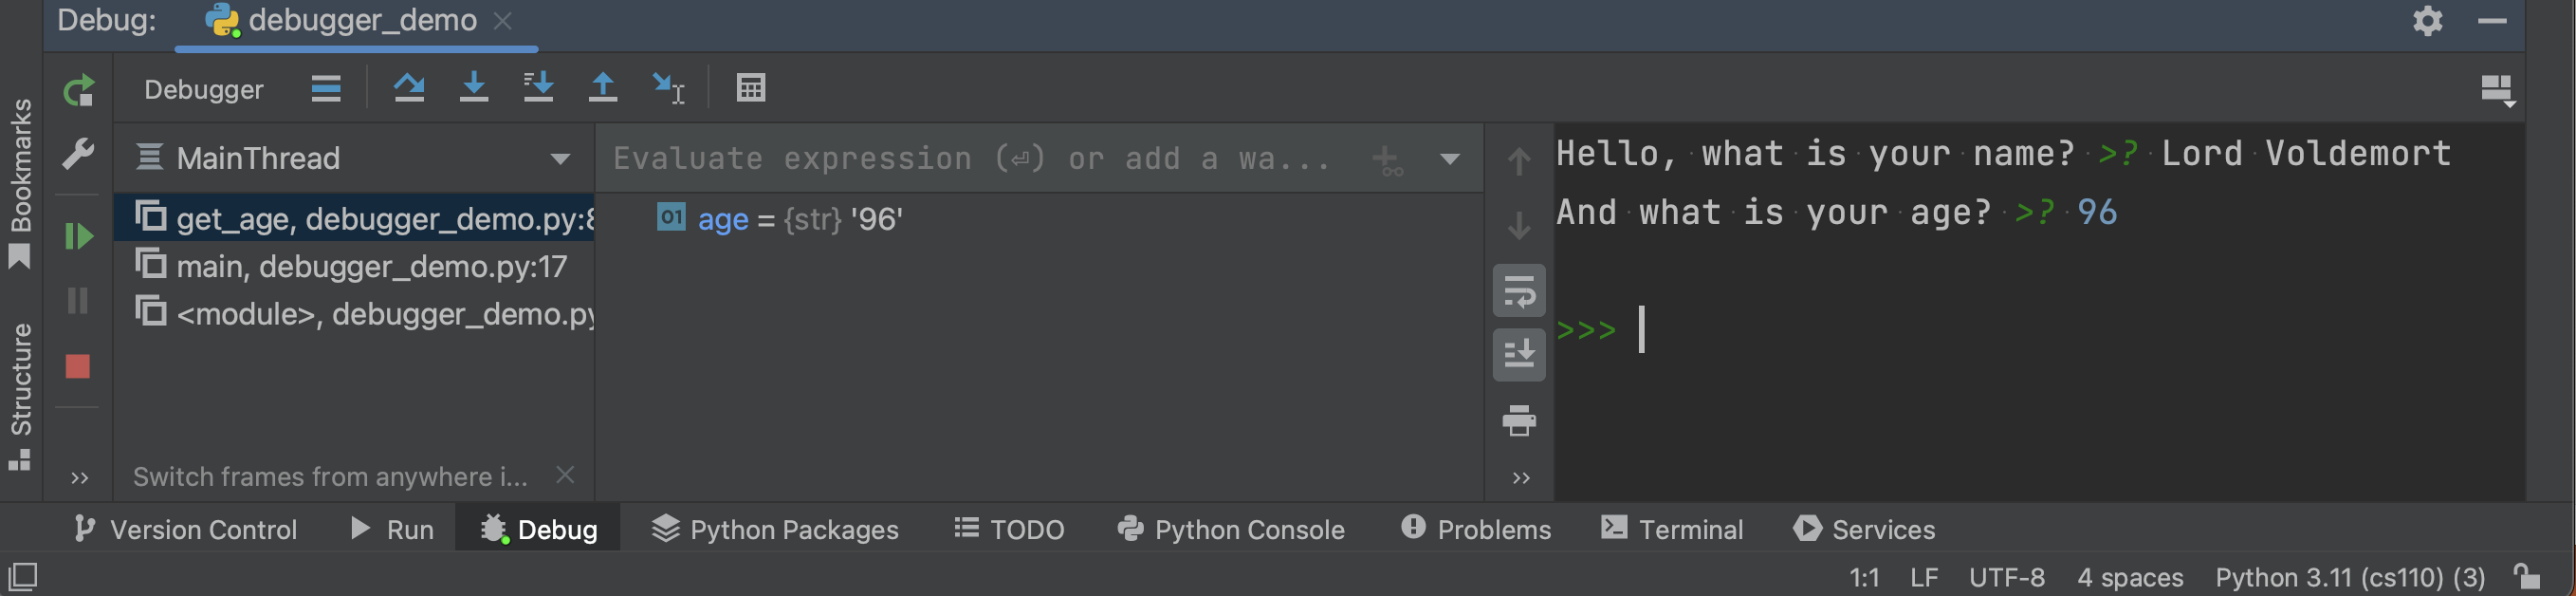
This is also shown in the main window:
Step out
Now click the step out button.
This will run all the rest of the code in get_age() and stop at the next line
of the previous function — main() in this case:
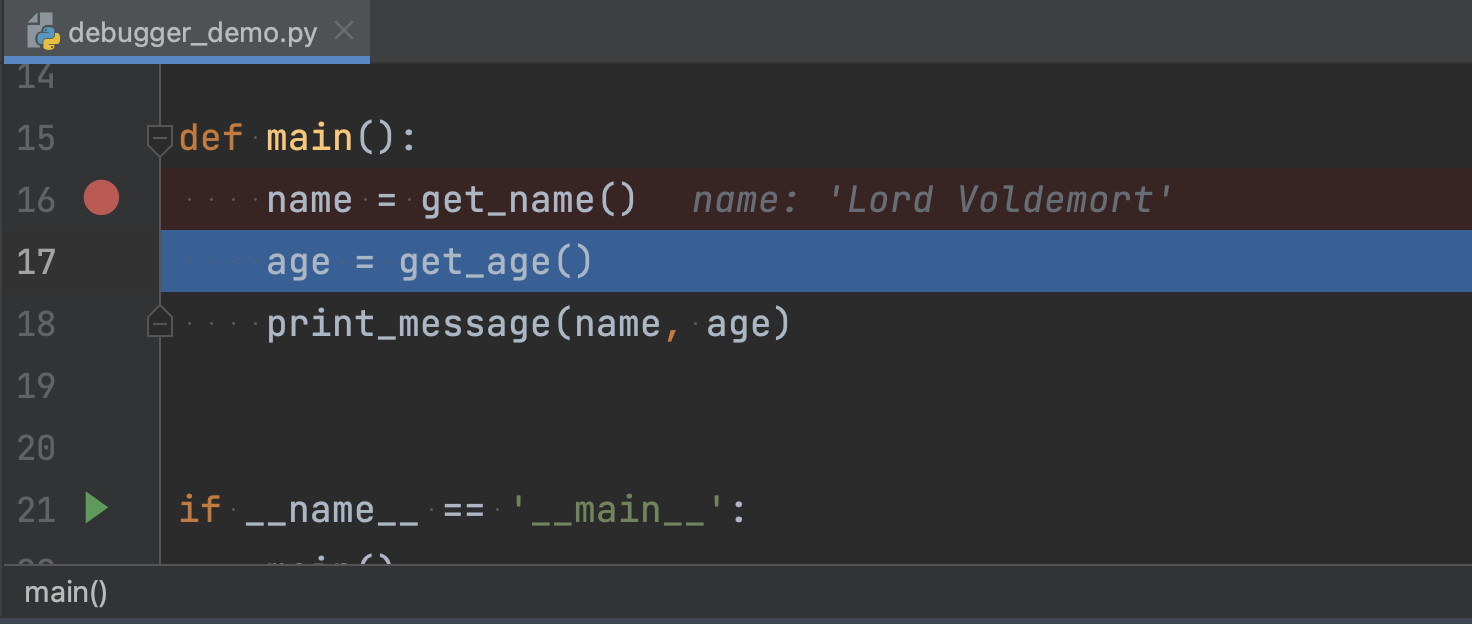
We are back to line 17, which is where we started before we pressed step into.
Return values
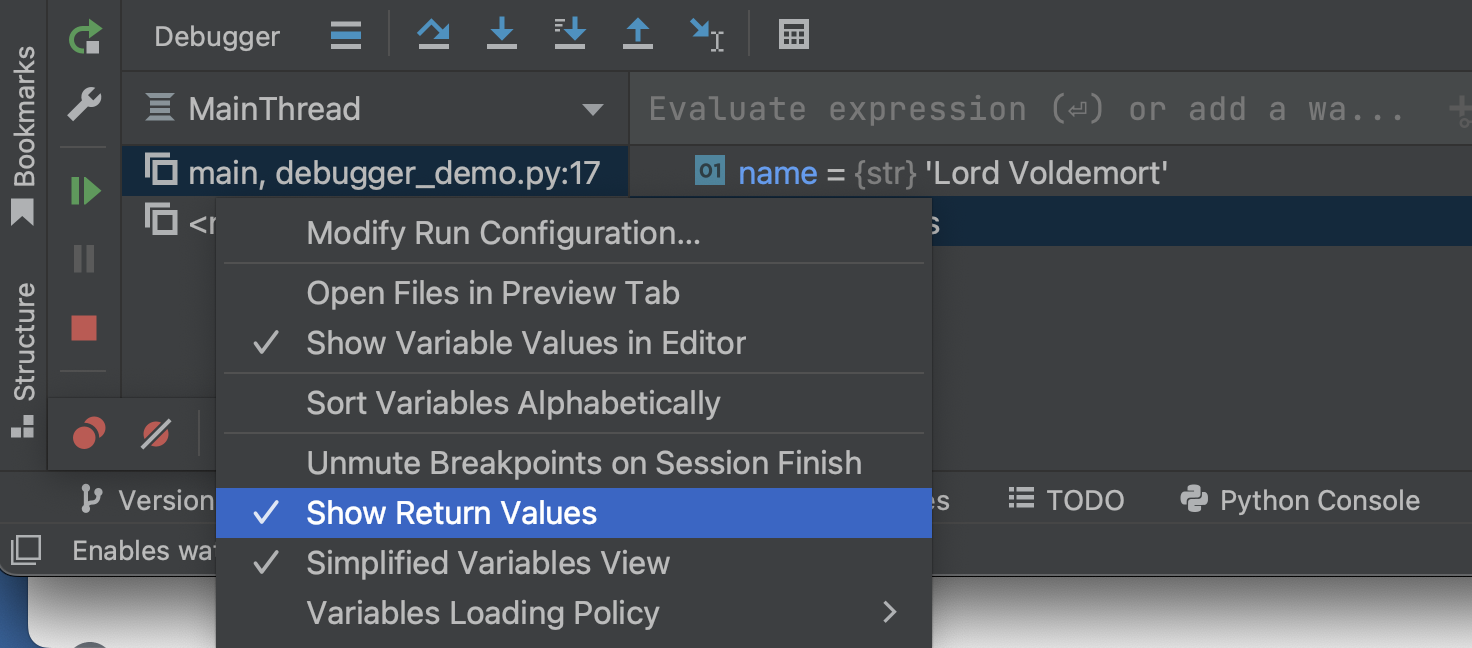
Look for a gear icon on the far left of the debug window. You may need to first
click >> to see it. Click on the gear and then select Show Return Values:
Now press step over to execute line 17 and look at the return values area of the debug window:
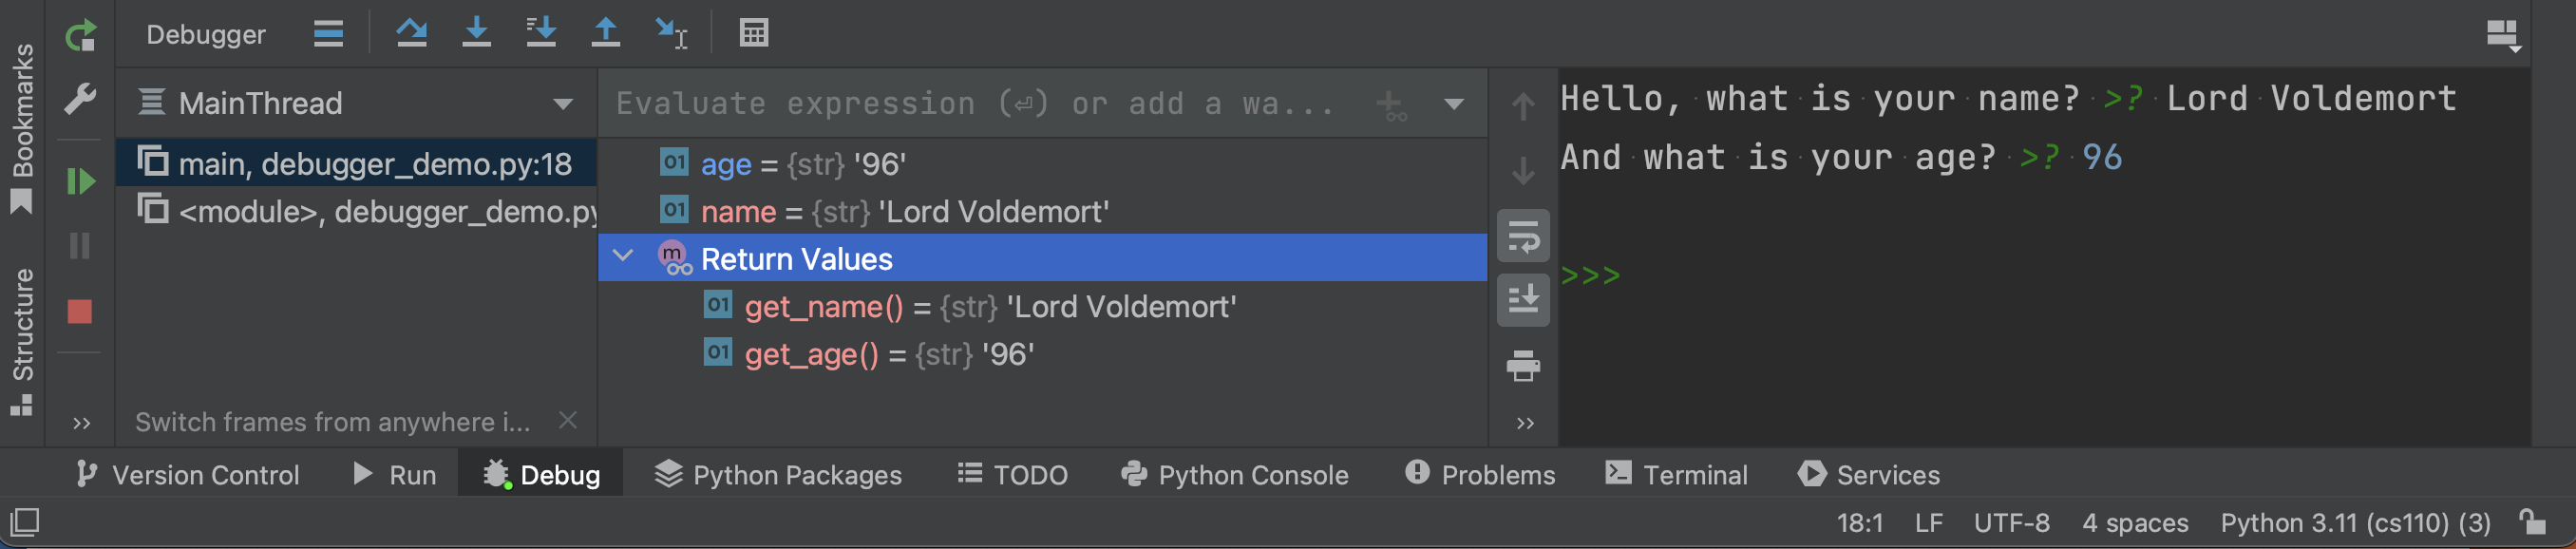
You can see the return values for every function that has been called.
Continue pressing step over and you will execute all of the rest of the program, one line at a time.
Review of stepping
Here is the difference between the different stepping buttons:
-
The step over button tells PyCharm to run the current line of code, including any functions that are listed, and show the result. Stepping over a line that includes a function means that function (and any functions it calls) gets executed as well, and you just see the end result.
-
The step into button tells PyCharm to run the current line of code, but if it includes a function, PyCharm will go into the function and stop at its first line. Note there is another step into button to the left of the one that is circled. Don’t use that one — it will step into the code of any libraries you use, which is usually not helpful if you are only concerned about your code.
-
The step out button tells PyCharm to run as many lines as needed to get to the previous function in the stack. The debugger window shows you the current stack of functions, so this button stops at the next line of code in the function that is the second one from the top.
More useful buttons
There are three useful buttons on the left of the debugging window:
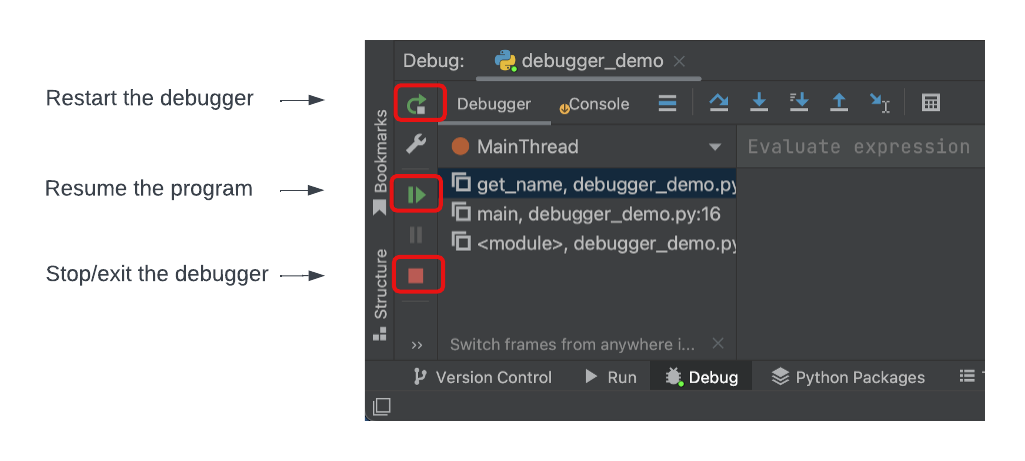
-
restart is helpful if you want to restart the debugging process all over again
-
stop is great if you just want to stop debugging, hopefully because you found your bug and know how to fix it
-
resume will run the rest of your program and will only stop if it reaches another breakpoint.
You can set multiple breakpoints in your program and then use resume to jump between them.
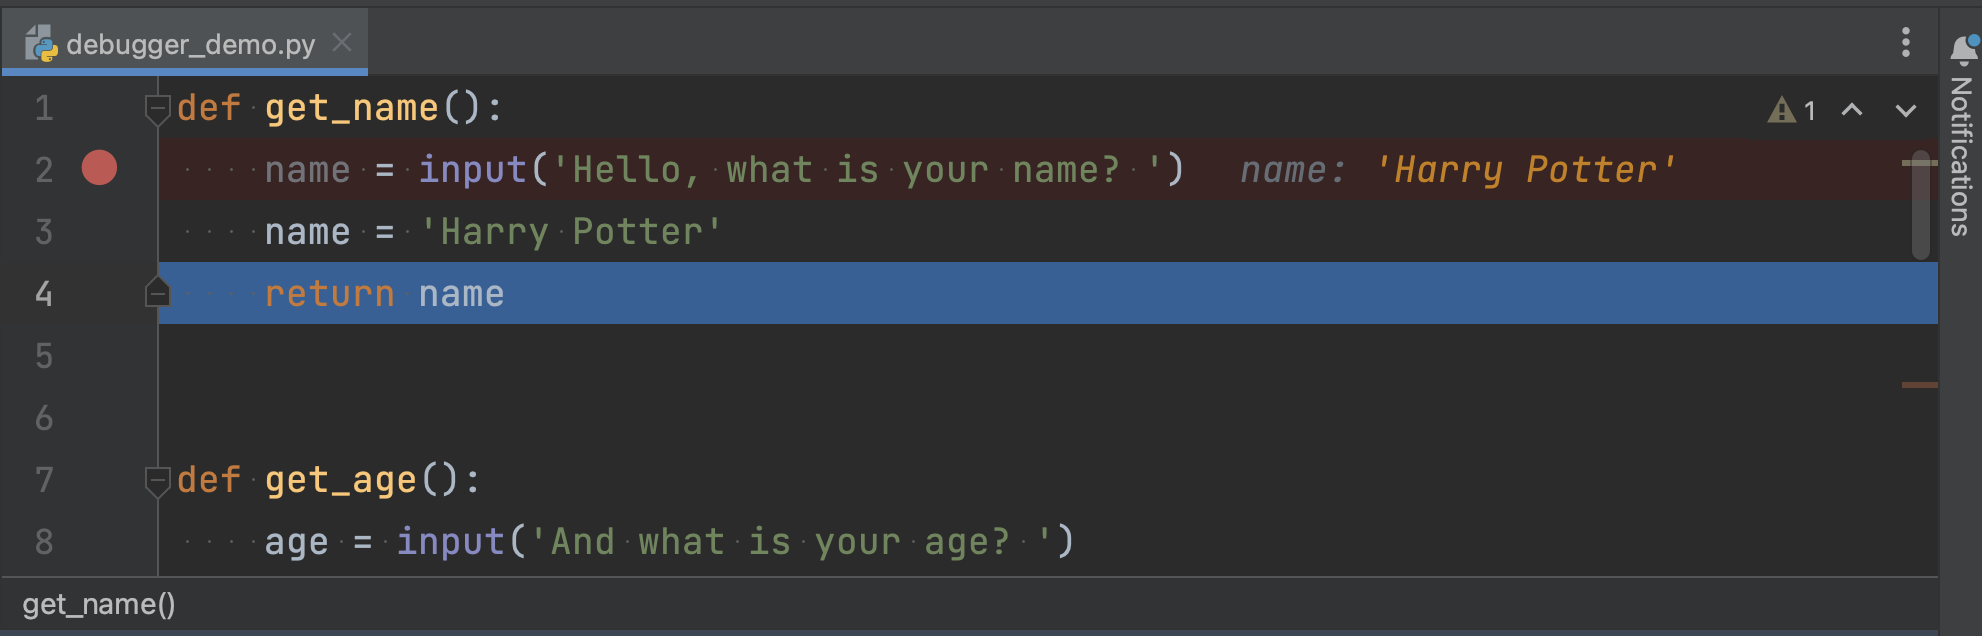
A “real” bug
Let’s see how everything works when we are tracking down a “real” bug. Modify
your program so that the get_name() reads like this:
def get_name() -> str:
    name = input('Hello, what is your name? ')
    name = 'Harry Potter'
    return name
Debug your program again (or click the restart button). Click the step over button to execute line 17:
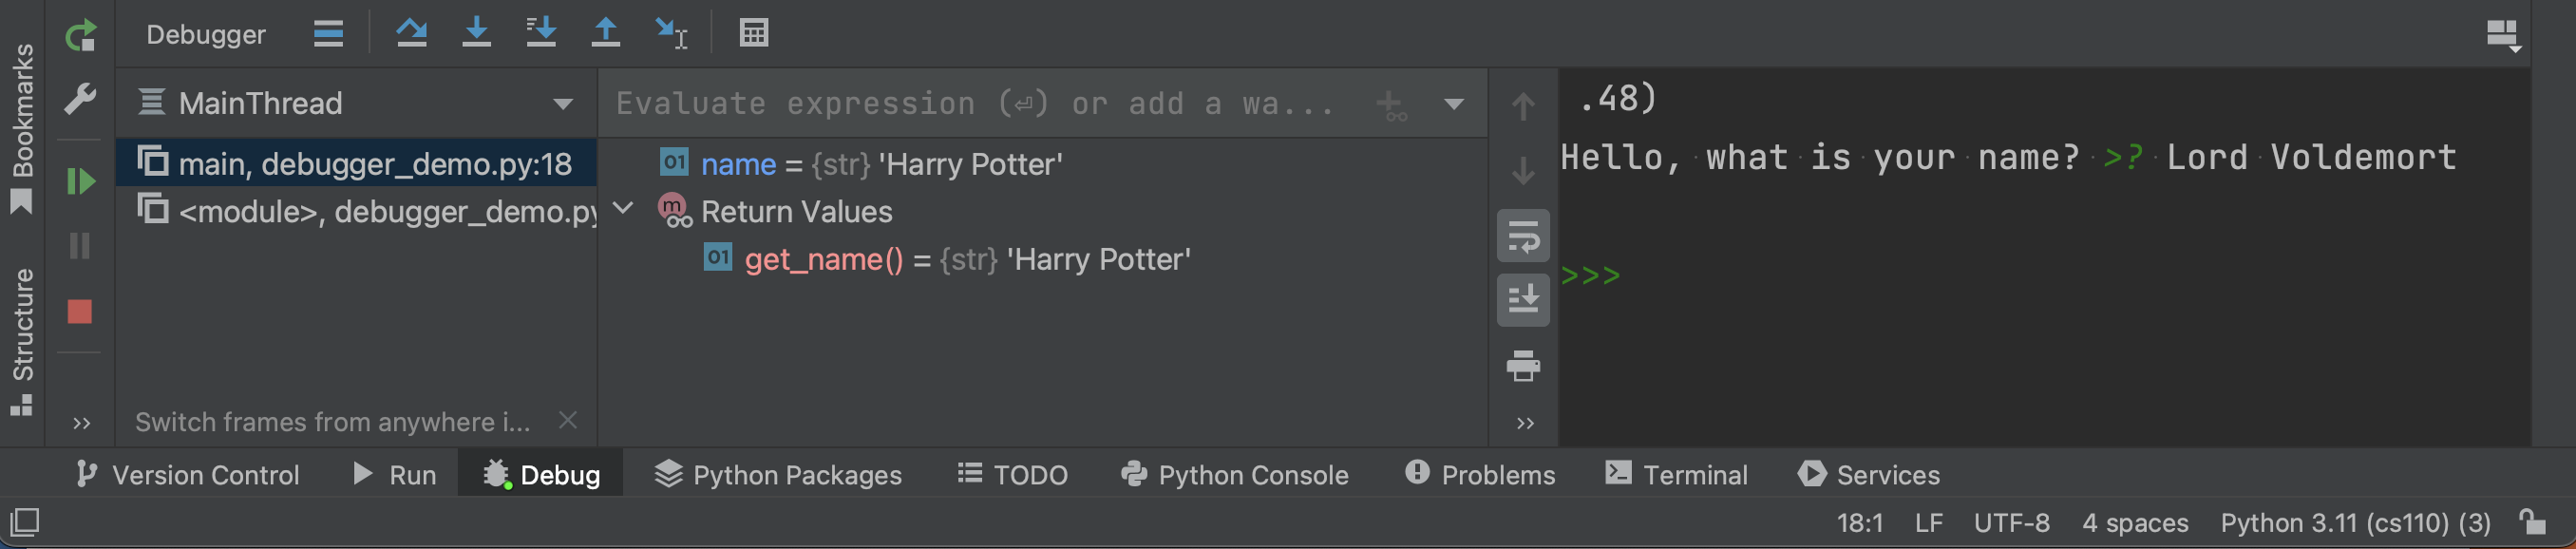
No matter what you type, the get_name() function always returns
'Harry Potter'. This means we need to debug get_name().
- Click and put a breakpoint at line 2.
- Click the restart button. PyCharm should show your program stopped at line 17 as usual.
- Click the resume button. PyCharm will continue and then stop at your second breakpoint, on line 2.
- Click step over and enter a name.
- Click step over and watch the
namevariable change!
No matter what you typed as input, the name variable gets overwritten. You’ve
found the bug!
The debugging process
Yes, this was a contrived example, but you can follow this debugging process reliably to find bugs:
- put a breakpoint in your main function
- step over every line, watching the variables and return values
- as soon as something happens that you don’t expect, create a new breakpoint in the function that is not behaving properly
- restart the debugging process and debug that function
- keep debugging functions as needed
This will be a lot easier if you have decomposed your program into small functions!
Now you have a new super power!